Home/Exhibits/Technology & Everyday Life/Global real-time carbon data

Global real-time carbon data

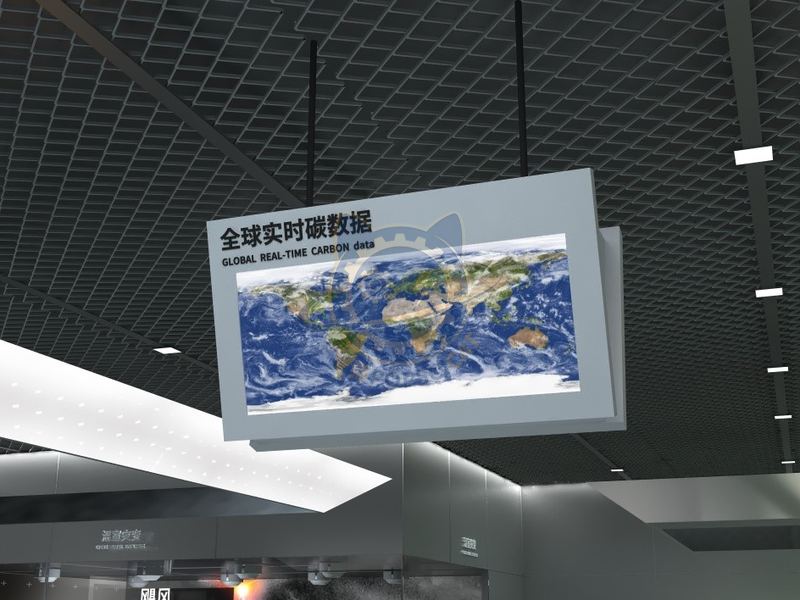
The exhibit mainly consists of display screens and computers.

Global real-time carbon data — Technology & Everyday Life exhibit for science museums
Reference image
CategoryTechnology & Everyday Life
Standard sizeCustom size
SupplySingle unit or batch · OEM to your drawing
Lead timeStandard 4–8 weeks after deposit (confirmed per contract)
Warranty1 year, structure and control
DocumentsSpecification sheet · control diagram · spare-part list

A standard catalogue model: the dimensions, control package and finish are fixed, which is what keeps the price and the lead time predictable. Size, colour and interface language can be adapted without a new design cycle.

Ask about this model → Email us

Standard models from this range are also listed in our online store, priced in USD — see the price yourself ↗
01 / Overview

The exhibit mainly consists of display screens and computers. By playing visualized charts of carbon emissions data from around the world and major countries, the current status and trends of carbon emissions are presented to visitors. By using intuitive graphics and dynamic charts, visitors can intuitively understand the distribution and changes of carbon emissions, as well as the contribution of carbon emissions from different countries. The content of the exhibits is based on data provided by the global carbon monitoring platform carbonmonitoring. org. cn, ensuring the authority and accuracy of the information. Through visual means, help visitors understand the current status and impact of global carbon emissions, and promote public attention to the governance and sustainable development of global carbon emissions.

02 / How visitors use it

The unit is designed for unsupervised public use: controls are recessed or shielded, moving parts are enclosed, and the interface is operable by a child of about six with no instruction. Where a screen is used, the language can be switched without changing the hardware, and the content can be replaced on site.

03 / The science behind it

The Carbon Monitor database provides global national and city level carbon emissions data from January 2019 to June 2024, showing a slight decrease of 0.06% in global daily carbon emissions, but an increase of 1.0% compared to 2019. The data reveals the dynamics of carbon emissions in various countries, such as a 1.63% increase in the United States and a 7.11% decrease in the European Union. At the urban level, Tokyo has reduced emissions by 12.63%, while Beijing has reduced emissions by 11.16%. In addition, there are global energy production and near real-time carbon maps, which are widely used in international research reports.

04 / Built for a public floor

Every unit leaves the factory after a running test: mechanisms cycled, electronics burned in, edges dressed, fixings torqued and marked. Wear parts — bearings, sliders, lamps, belts, touch panels — are modular and listed on the spare-part sheet, so a venue technician can replace them without returning the exhibit. Crating is plywood with foam blocking; the loading plan and packing list travel with the shipment.

Same category

More in Technology & Everyday Life

Other models from the Technology & Everyday Life line, all held to the same specification and the same control package.

Start a project

Send us your exhibit list.
We will come back with a price.

Attach a theme outline, a floor plan, or nothing at all — a photo of the space is enough to start. Quotations are issued against a real exhibit list, not per-square-metre guesses.

WeChat QR code — scan to message us Scan to add us
on WeChat